![]()
![]()
Stamps
By
Brandon Samples
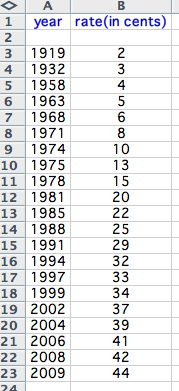
The price of stamps seems to increase frequently, so it is interesting to think about predicting the future price changes. In order to model the price, we need to begin with some data.
Now, we can start to construct a graph associated to this data.
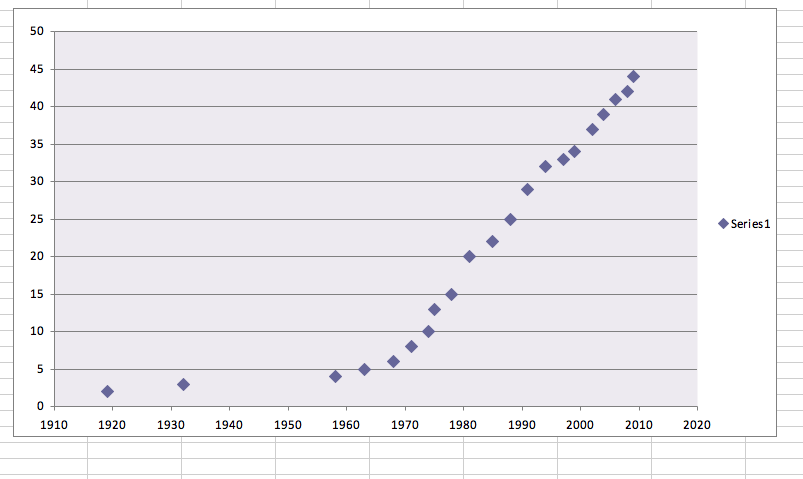
Now, it seems that the behavior is exponential, so we might try to develop some exponential models. If we use the first two points, we can construct our first exponental function:
f(x) = 2 exp(ln(3/2)(x-1919)/13).
Now, what values does this yield?
So this model is pretty good. When does it tell us that the price will be 60 cents? How about a dollar?


Now, what if we choose two different starting values?
How about we take the third and fourth value?
We have the following exponential function:
f(x) = 4 exp(ln(5/4)(x-1958)/5).
Using mathematica, we can find a solution for 60 cents:

Again, what about 1 dollar?

So clearly, the outputs change dramatically based on the data set, but these only took into account the first few values. So what other methods are available to us, so that we may obtain a more accurate model?
Well, Excel has a handy feature, which allows someone to attach a trendline to a given data set. Let do this in this case.
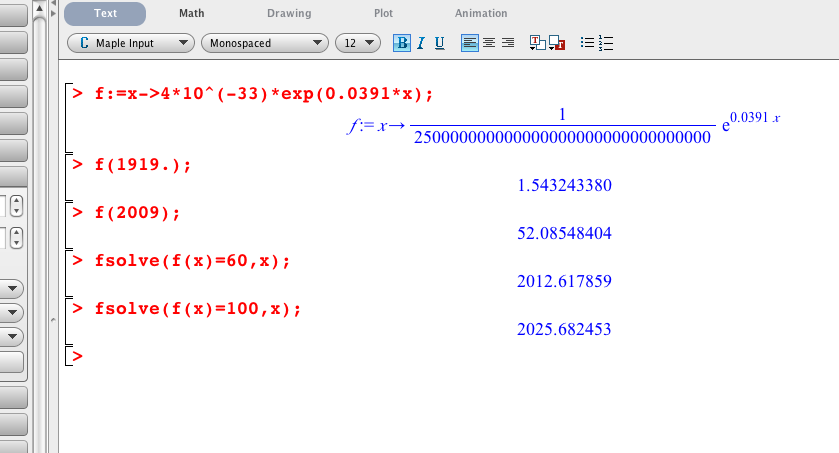
The function that it creates is
f(x) = 4x10^(-33)e^(.0391x)
whose graph is included in the following figure.
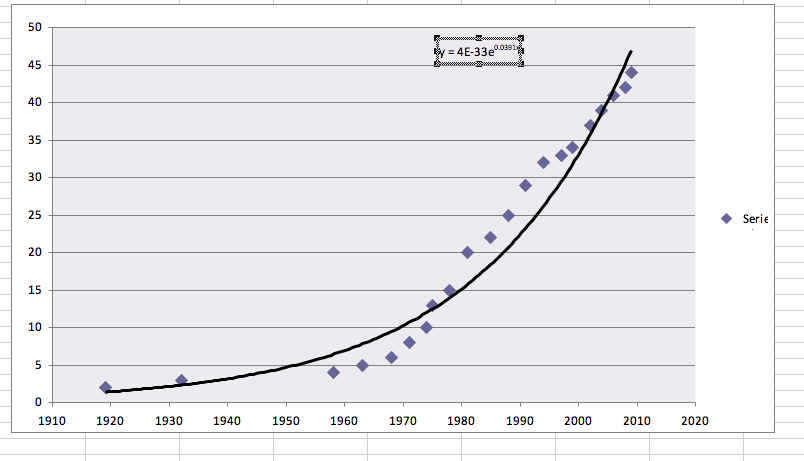
Okay, this looks like a good model, so what does it tell us about our original question? When might we expect the price to be 60 cents? 1 dollar?
What's interesting about these results is that they are probably pretty accurate given trends over the last 20 years. I have included by mathematica and excel files for your own explorations. It's exciting that excel has the ability to quickly estimate trends using exponential, logarithmic, and polynomial functions.